
Banking Sector Decoded - 5 ratios you need to know before investing.
This blogs explain how investor can protect themselves from banking crisis and 5 essential banking ratios—Net Interest Margin, Non‑Performing Assets, Capital Adequacy, Price to book and CASA—what they mean, how to find red flags and how to use them to judge a bank’s profitability, resilience, and efficiency.
FINANCE
Het Pradhan
9/2/20254 min read

Did you wonder "Why the Dow Jones crashed 58% from its peak… shocked? You should be. To understand how history was made, let’s rewind to 2008 — the year that creates global history"
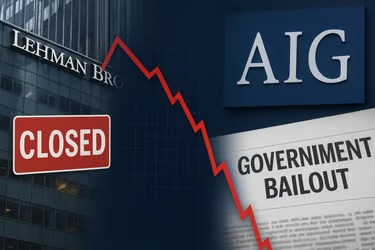
2008 : Lehman’s Fall vs AIG’s Rescue
Lehman Brothers, the fourth-largest investment bank in the US, was allowed to collapse on September 15, 2008. After Years of too much leverage, risky mortgage-backed securities, and deteriorating liquidity. When confidence vanished, the government chose not to intervene. The result? Lehman filed for bankruptcy with $600 billion in assets, shareholders were wiped out, and the Dow Jones dropped more than 500 points in a single day. It remains the largest bankruptcy in US history.
Now compare with AIG(American International Group). The insurance giant had sold billions worth of contracts that guaranteed mortgage bonds. If AIG went bankrupt, banks and funds all over the world would face huge losses, spreading panic across the system. To prevent that, the US government stepped in with a $182 billion bailout, effectively taking control of AIG. Customers and partner firms were protected — and the financial system stayed alive.
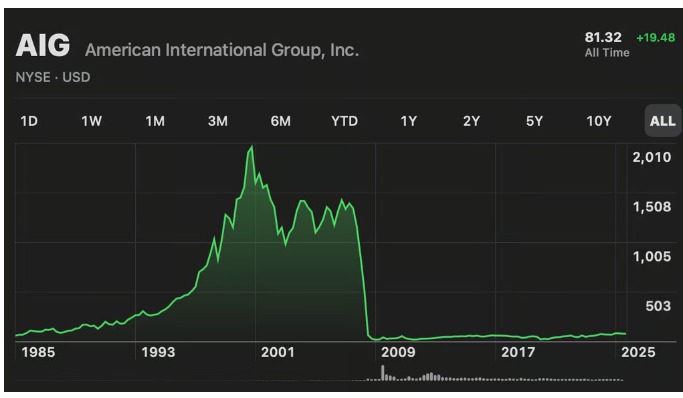
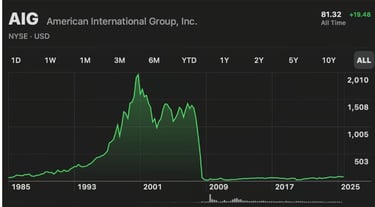
But equity holders? Their story was no different from Lehman’s. AIG’s stock price, once above $1,400 (split-adjusted), collapsed to under $0.35(all-time low) Currenty at ~$82(As on 1st Sep,2025). Shareholders bore the cost of survival, even as the institution was rescued.
The difference is clear: Lehman was allowed to die, AIG was saved. Yet in both cases, equity investors lost almost everything. This clearly shows that there is nothing like "too big to be fail" if fundamental aren't intacted. Here are some Indian example -
When Banks Break: India’s Case Studies
Fast Growth ≠ Strong Bank ( Yes Bank 2020)
Yes Bank showed how rapid expansion without strong checks leads to hidden bad loans, unethical practices and too many RPT (related party transaction) have lead to eventual collapse.Risky Lending Destroys Capital (Lakshmi Vilas Bank 2020)
Lakshmi Vilas Bank proved that lending too much to weak corporates without enough capital can sink even a 90-year-old bank.Fraud Breaks Trust Overnight (PMC Bank 2019)
PMC Bank revealed how hiding NPAs and related-party fraud can destroy depositor faith in a moment.Low Capital = High Risk (United Western Bank’s 2004)
United Western Bank’s downfall showed that when capital is weak and NPAs rise, regulators step in with forced mergers.
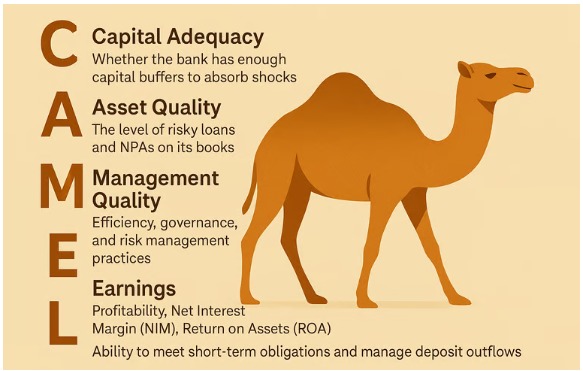
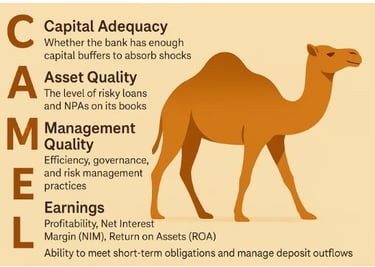
THE CAMELS MODEL
CAMELS model has been a widely useful tool for analysing financial institutions. It evaluates a bank’s strength across six key factors:
•Capital Adequacy – whether the bank has enough capital buffers to absorb shocks.
•Asset Quality – the level of risky loans and NPAs on its books.
•Management Quality – efficiency, governance, and risk management practices.
•Earnings – profitability, Net Interest Margin (NIM), Return on Assets (ROA).
•Liquidity – ability to meet short-term obligations and manage deposit outflows.
•Sensitivity- Sensitivity covers how particular risk exposures can affect institutions.
By keeping an eye on all these six dimensions, investors can catch early signs of trouble and gives a far more accurate picture of a bank’s stability and long-term investment potential
5 Key Financial Ratios Every Investor Should Know:
1. Capital Adequacy Ratio (CAR) | Higher the Better
This ratio measures how well a bank can absorb potential losses. It shows the percentage of a bank’s capital compared to its risk-weighted assets.A higher CAR better it it, so it can handle losses or tough times better without collapsing.
Why it matters: If CAR falls below the regulatory minimum (as set by RBI or Basel norms), the bank could face restrictions on lending or even risk collapse.
Red flag - If a bank’s capital ratio is consistently weak, it means the institution may not be able to absorb loan losses. A sudden fall here is an early warning.
2. Non-Performing Assets (NPA) Percentage | Lower the better
NPAs are loans where borrowers have stopped paying interest or principal. The NPA percentage shows the share of bad loans in a bank’s portfolio.
Why it matters: A rising NPA ratio signals deteriorating asset quality. It directly eats into profits because the bank has to set aside provisions for potential losses.
Red flag - Rising NPAs or too much exposure to risky sectors often hint at stress well before it shows up in earnings.
3. Net Interest Margin (NIM) | Higher is better
NIM shows how efficiently a bank earns income from its lending compared to the interest it pays on deposits. It is calculated as net interest income divided by average earning assets.
Why it matters: A higher NIM means the bank is lending profitably. Falling NIM can signal rising costs of funds or pressure on lending margins.
Red flag - Declining Net Interest Margins (NIM) or volatile profitability can point to deeper structural problems.
4. CASA Ratio (Current Account & Savings Account Ratio) | Higher is better
This measures the share of deposits that come from current and savings accounts. Since these deposits usually carry very low interest, they are a cheap source of funds for the bank.
Why it matters: A high CASA ratio means the bank has low-cost funding, giving it more flexibility to lend at better margins.
Red flag - Declining CASA ratio may suggests depositors are shifting money away, often into fixed deposits (higher rates) or rival banks, raising funding costs (losing its competitive edge)
5. Price-to-Book (P/B) Ratio | Depends on context
The P/B ratio compares the market value of a bank’s stock to its book value (net assets). For banks, this is often more useful than the P/E ratio. Why? PE ratio is unreliable for banks because earnings are volatile, easily managed through loan provisions, does not reflect asset quality and distorted by regulatory requirements, making them an unstable measure of value.
Why it matters-
Lower P/B (<1) – May indicate undervaluation if the bank’s fundamentals (asset quality, profitability, governance) are strong. However, a very low P/B can also signal that the market has serious concerns about the bank’s future — such as rising NPAs, weak earnings, or governance risks. Caution is needed.
Higher P/B (>1.5–2) – Could suggest the stock is overvalued, but for high-quality, fast-growing banks with strong CASA, low NPAs, and consistent profitability, a higher P/B may be justified.
Red flag - A very low P/B doesn’t automatically mean “cheap” — it may be a warning sign. Always check the bank’s fundamentals before drawing conclusions that why market is giving such low valuation to the bank ? Does it has very huge contingint liability or has poor governance issues ?
This blogs cover the reason of big financial frauds, how to detect it and avoid pitfalls and factors which investor has to keep eye on for understanding the financial position and competitive landscape of company. Happy investing ~
Investing & Finance
Develop the Right mindset of investing in the indian stock market from the masters.
Join our Master Investor Community and develop the Right mindset of investing
Subscribe
contact - arya@masterinvesting.in
© 2025. All rights reserved.